
Table of Contents
ToggleWhat is an analytical paragraph?
Analytical paragraph is a form of descriptive writing which is written on the basis of a given
chart, graph, data, outline, clues, table etc. It requires analysis and comparison of the given facts
and drawing conclusion based on the given data. When writing an analytical paragraph, one
should remember to describe the facts in the best possible manner and cover the information
provided. The paragraph must use clear and crisp language along with providing complete details
of the data provided in the question.
Features of an Analytical Paragraph:
- It describes the given chart, table, data, graph, cues etc.
- It should be brief and comprehensive but at the same time, include complete
information.
- It should state the facts that are provided.
- It should have simple and accurate language.
- It should mention figures and quantities appropriately.
- It should use the same tense throughout, as far as possible.
- It should not provide any personal observation or response.
- It should preferably use the passive form of the verb.
Format of an Analytical Paragraph
Content in 100-120 words
The content of the paragraph must include the following:
- Introduction (explain in one or two lines the context or what is clearly evident from the
chart or graph)
- Body of the paragraph (explain in detail the figure and trends, making comparisons and
contrasts)
- Conclusion (give the overall view or summary of the chart or graph)
Points to Remember:
- We must not include any personal opinions, conclusions or observations but simply
stick to the facts.
- We must choose wisely the important information, organize it well, state the correct
facts and summarize it properly.
- For introduction, we can start with phrases such asThe chart given above describes…/The given table suggests…/ The line graph
shows…/ The data given provides information about…/ The pie chart illustrates…, etc.
- For body of the paragraph, we should organize the information well. We should look
for the large differences that are very prominent. We can mention the aspect which is
the smallest or the largest in the data given. Any aspect that is similar should be
mentioned next. We should further mention about the aspect that has remained
unchanged or is constant throughout.
- If the chart or table mentions two different groups, we should refer to both of them in
the paragraph. If there is any contrast or comparison that could be drawn, we must
present it effectively. If the chart is about a particular time period or highlights trends
of several years, we should mention about each year in a concise manner. If any
comparison or contrast can be made for two or more years, we should write about that
too.
- For describing the pattern of growth, we can use words and phrases like- ‘rapidly
doubled’, ‘skyrocketed’, ‘striking increase’, ‘peaked’, ‘soared’, ‘declined’,
‘plummeted’, ‘leveled off’, ‘stagnated’, ‘fluctuating’ , ‘starting to rise’, ‘starting to
fall’, ‘drop down’, ‘slightly’, etc.
- Mentioning quantities: When including numbers and figures, the accuracy must be
ensured. Quantities can be described in a number of ways, such as percentage, fraction,
ratios etc. For describing quantities, we can also use words and phrases like ‘one-third
of’, ‘nearly one-fourth of’, ‘majority’, ‘on an average’, ‘twice as much’, ‘almost equal’,
‘the highest’, ‘the lowest’, ‘approximately’, etc.
- For establishing relationship or contrast, we can make use of words and phrases like-
‘similarly’, ‘in contrast with’, ‘ in comparison to’, ‘however’, ‘whereas’, ‘as opposed
to’, ‘while’, ‘a striking difference’, ‘a noticeable difference’, etc.
- For conclusion, we may use words and phrases like ‘overall’, ‘subsequently’, ‘in all’,
‘in a nutshell’, ‘in short’, ‘therefore’, etc.
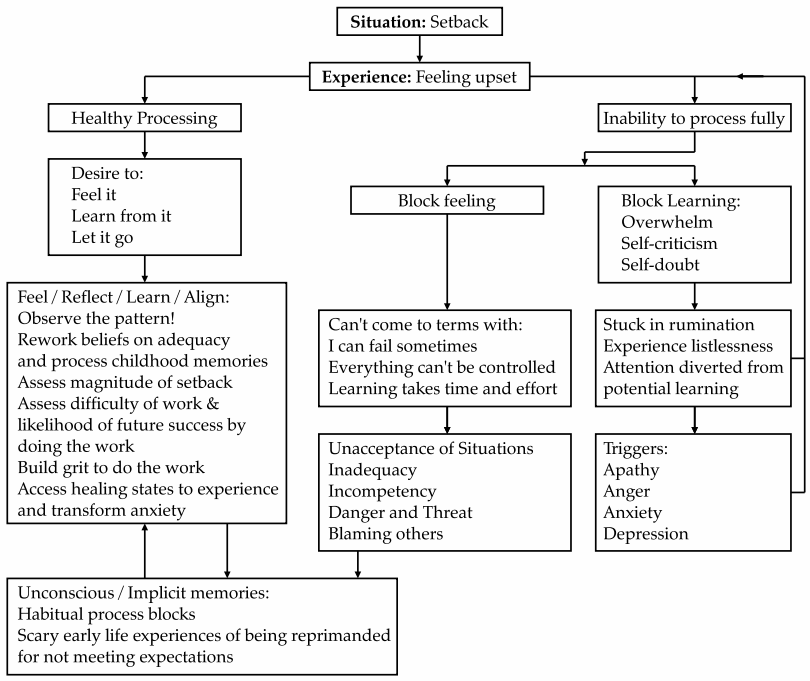
1. Study the concept chart from the self-help magazine section of a monthly publication. (5 marks)
Write a paragraph in not more than 120 words, analysing the listed responses to the situation when one faces setbacks
Answer:A Possible Answer drafted for students
Setbacks
Setbacks bring the feeling of dejection and despair leaving one with a feeling of disappointment and sometimes even worse. The given concept chart displays two ways to handle setbacks, for the better or for the worse — healthy and unhealthy. Healthy processing helps one learn from and let go the emotions inside. One should believe in oneself. In all of your jobs, expect that you will do well at your job. Your co-workers enjoy working with people with a ‘can-do’ attitude. Think about what you learned or gained from each new situation. An optimistic way of seeing a setback processes the ability to feel, reflect, learn and align. On the contrary, inability to process leads to a block, self-criticism and self-doubt often times, we tend to wait for the setback to pass before we can move on. Very few times do we actually take up the deal with the failure head on. Acknowledging it and taking proactive mental and physical action to minimize the effect is what ‘handing’ a failure gracefully really means. Hence, responding to setbacks the positive way is empowering as it leads to success.
Q.2. A group of enterprising young adults conducted a survey on reopening of educational institutions in the National Capital.Write a paragraph in about 120 words analysing the listed responses.
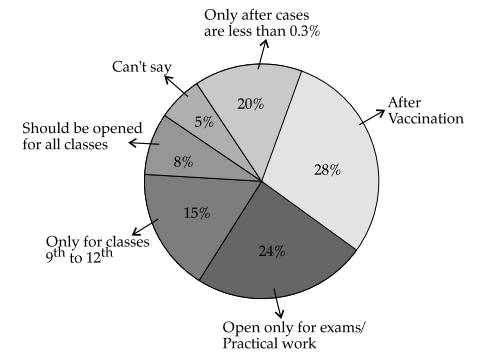
Answer:In light of current education crises due to COVID-19, a survey on reopening of educational institutions in the National Capital was conducted by a group of enterprising young adults. 28% people opined that the educational institutions should allow the students and other staff only after complete vaccination, i.e. they should be allowed to enter the campus only after they are vaccinated. As many as 24% people believed that schools should reopen only for exams/practical work; whereas 20% people were of view that it would be wise to open these institutions only after the cases are less than 0.3%. A few people (15%) seemed to be in support of the reopening of schools, coachings etc., only for class 9th to 12th whereas 8% people were in favour of reopening the same for all classes. Only 5% of persons couldn’t say anything in this matter. Hence, we see that approx. 75% people wanted that it’s time for educational institutions to move on with full precautions whereas 20% are still waiting for the situations to become better and 5% of them are perhaps on ‘wait and watch’ stand.
Q.3. A survey was conducted in the National Capital in over twenty schools about the different activities that interest the children in the age group of 13 years to 15 years. Write a paragraph in not more than 120 words, analyzing the following information.
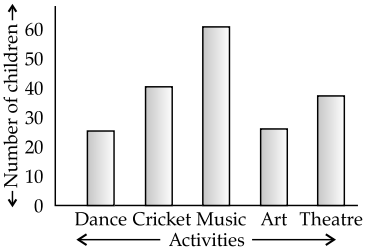
Answer:A survey was conducted in more than twenty schools of New Delhi about the different activities that interest the children in the age group of 13 year to 15 years. It was amazing to know that it was not playing cricket in which maximum students showed their interest. Rather music interests the maximum number of school children. Then, with a great margin, cricket becomes their second choice. It may be due to the reason that during corona period, children had to shift their preference to solo and indoor activities. Again, just with a little difference children seem to be interested in theatre. Unexpectedly, dance as well as art has been placed as their last but not the least choice of these budding artists. Above all, the survey brought out this ‘healthy’ fact in notice that growing students prefer real activities to virtual games/activities.
Q4. The chart below displays data about the number of digital devices purchased in Rishu nagar across the years 2015-2019. Write a paragraph analysing the given data.

Answer:Technology governs every facet of our life and the given data shows how the staggering figures of digital device sales. The given data clearly shows how from being a luxury computers and smartphones have become a necessity. In 2015, about 3500 computers and 42000 smartphones were purchased. However, the sales of digital devices have shown a gradual increase over the past four years. There is a very clear indication that people prefer buying smartphones over computers. The sales of smartphones have always been more than computers barring the year 2017 when in contrast to 81000 computers 78000 smartphones were sold. Preference of smartphones also indicates that people find it easier to work with smartphones and since they offer much of the same features as computers and are easy to carry. The year 2019 shows a sharp spike crossing the 100,000 mark in a year which is a clear indicator of our dependence on this digital device. It can be easily calculated from the given the present situation the sales are bound to continue with this upward trend and it is sure to impact more in future.

Founder of Englishfry.com, a captivating and knowledge-driven blog & Founder of Android app/website Studyfunnel.com, an online Mock Test Series Portal. With a wealth of experience spanning over 16+ years, he has excelled as an Ex-Asst.Professor, Teacher, Amazon published author, Website Developer, Graphic Designer,Blogger,Poet, and Creative academic content writer publisher of 4 academic books available Online on Amazon & Flipkart. His tryst in Literature helped him realize his love for writing and telling stories. A tech-savvy language nerd by day and, a passionate writer by night, he now translates his experiences into tales of wisdom served with a side of humor.His widely recognized profound insights ,captivating writing style of weaving words make him contribute to prestigious publications and a sought-after authority in the field that transport readers to extraordinary worlds.